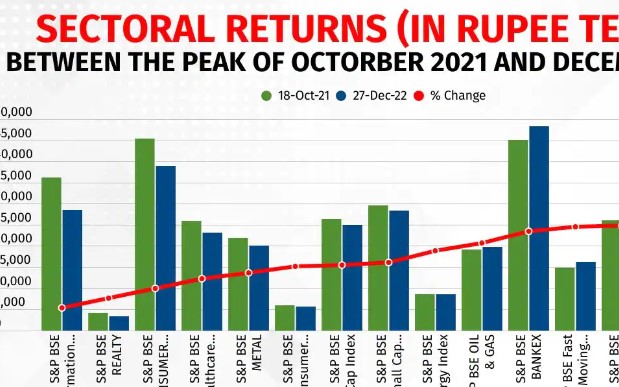
The analysis of cash indices performance over time is crucial for trading and investing in financial markets. It can provide valuable information about the direction of a country or sector's performance, market trends, and potential trading opportunities. In this article, we will walk you through the steps required for better analyzing cash indices performance and give you useful tips if you want to add cash indices to your trading strategy.
What are cash indices? Definition and Examples
There are many indices you can trade when deciding to invest in the financial markets, from the Asian markets to the American markets and European markets, among others. When choosing which index to focus on from the world’s most active indices, you will also see that you can trade different kinds of indices, like futures on indices or cash indices.
Cash indices are the most indorsed ways to profit from the performance of a group of stocks that is representative either of a particular geographical market or of a specific industry, and whose prices are based on the current prices of the stocks included in each index at any given time. Traders can find popular Cash Indices at easyMarkets such as - S&P 500, DJIA, Nasdaq, FTSE 100, Euro Stoxx 50, DAX 40, Nikkei 225, S&P/ASX 20, CSI 1000, and Shanghai Composite are among the most marketable cash indices in the world.
As an index cannot be traded per se, you’ll need to find the best financial product to trade cash indices for your trading. Exchange-Traded Funds (ETFs) and Contracts for Difference (CFDs) are among the most popular ways to trade cash indices, especially among retail traders.
How to analyze cash indices performance over time
There are different steps to follow and factors to take into consideration when analyzing cash indices performance over time to make better trading decisions:
• Understand how cash indices work - The first step is to understand the index you’re trading and what influences its value the most. You will need to know the components of the indices and the weight of each component to know which kind of companies have the greater influence on the index’s value.
You will also need to understand how an index is computed, as there are two main kinds of indices: price-weighted indices and market-capitalization-weighted indices.
While the first method is used by adding up the prices of all the components and dividing the total by a divisor, such as for the Dow Jones and the Nikkei 225, the second method is the most common, and is used by weighing each stock in the index by its market capitalization, which is the total value of all outstanding shares.
• Choose a timeframe - This step is essential when analyzing a market because it allows you to focus on specific trends and patterns that are relevant to your strategy, and helps you make more informed decisions based on historical data. Always remember that longer timeframes will provide insights into the big picture.
Scalpers are very active traders that aim to profit from very small movements, which means that their analyses are usually done through tick charts, 1-minute charts, 5-minute charts and 15-minute charts. Day traders are still active traders but less aggressive, so they will focus on 15-minute charts, hourly charts and 4 hour charts.
Swing traders usually focus on short to medium-term market movements, which means that they will use longer time frames, such as daily charts, weekly charts and even sometimes monthly charts to identify trends.
• Use technical analysis - By analyzing cash indices performance over time through charts, you’re trying to get insight into the direction of a given asset to determine its future direction and profit from it by looking at historical data, usually through what’s called technical analysis.
Technical analysis is a method of analyzing financial markets by studying price action, volume data, and technical indicators in order to identify the main trend, chart patterns and significant price levels that can be used to make better trading decisions.
There are many technical indicators and tools that can be used depending on your trading experience and knowledge, which can help you get a better understanding of the market forces (buyers vs sellers) and the main market sentiment driving traders’.
Bottom line
Once you’ve determined your trader’s profile, you will be able to select the best financial product to trade cash indices depending on your risk appetite, your trading style, and your strategy, as well as your trading objectives and your trading plan. It will also help you better analyze cash indices performances over time.
Always remember that trading cash indices represents a certain level of risk and is not for every trader (especially if you use leveraged products like CFDs). Still, if you have a certain market knowledge and experience and a sound trading plan with money management rules, you should be able to take advantage of the numerous market opportunities offered by the index market!


